Your metrics are just SQL
Everything bewitch collects lands in DuckDB, and bewitch repl is a real console over your own history — tab completion, multi-line queries, dot-commands, and export to CSV, Parquet, or JSON. Ask it whatever you like.

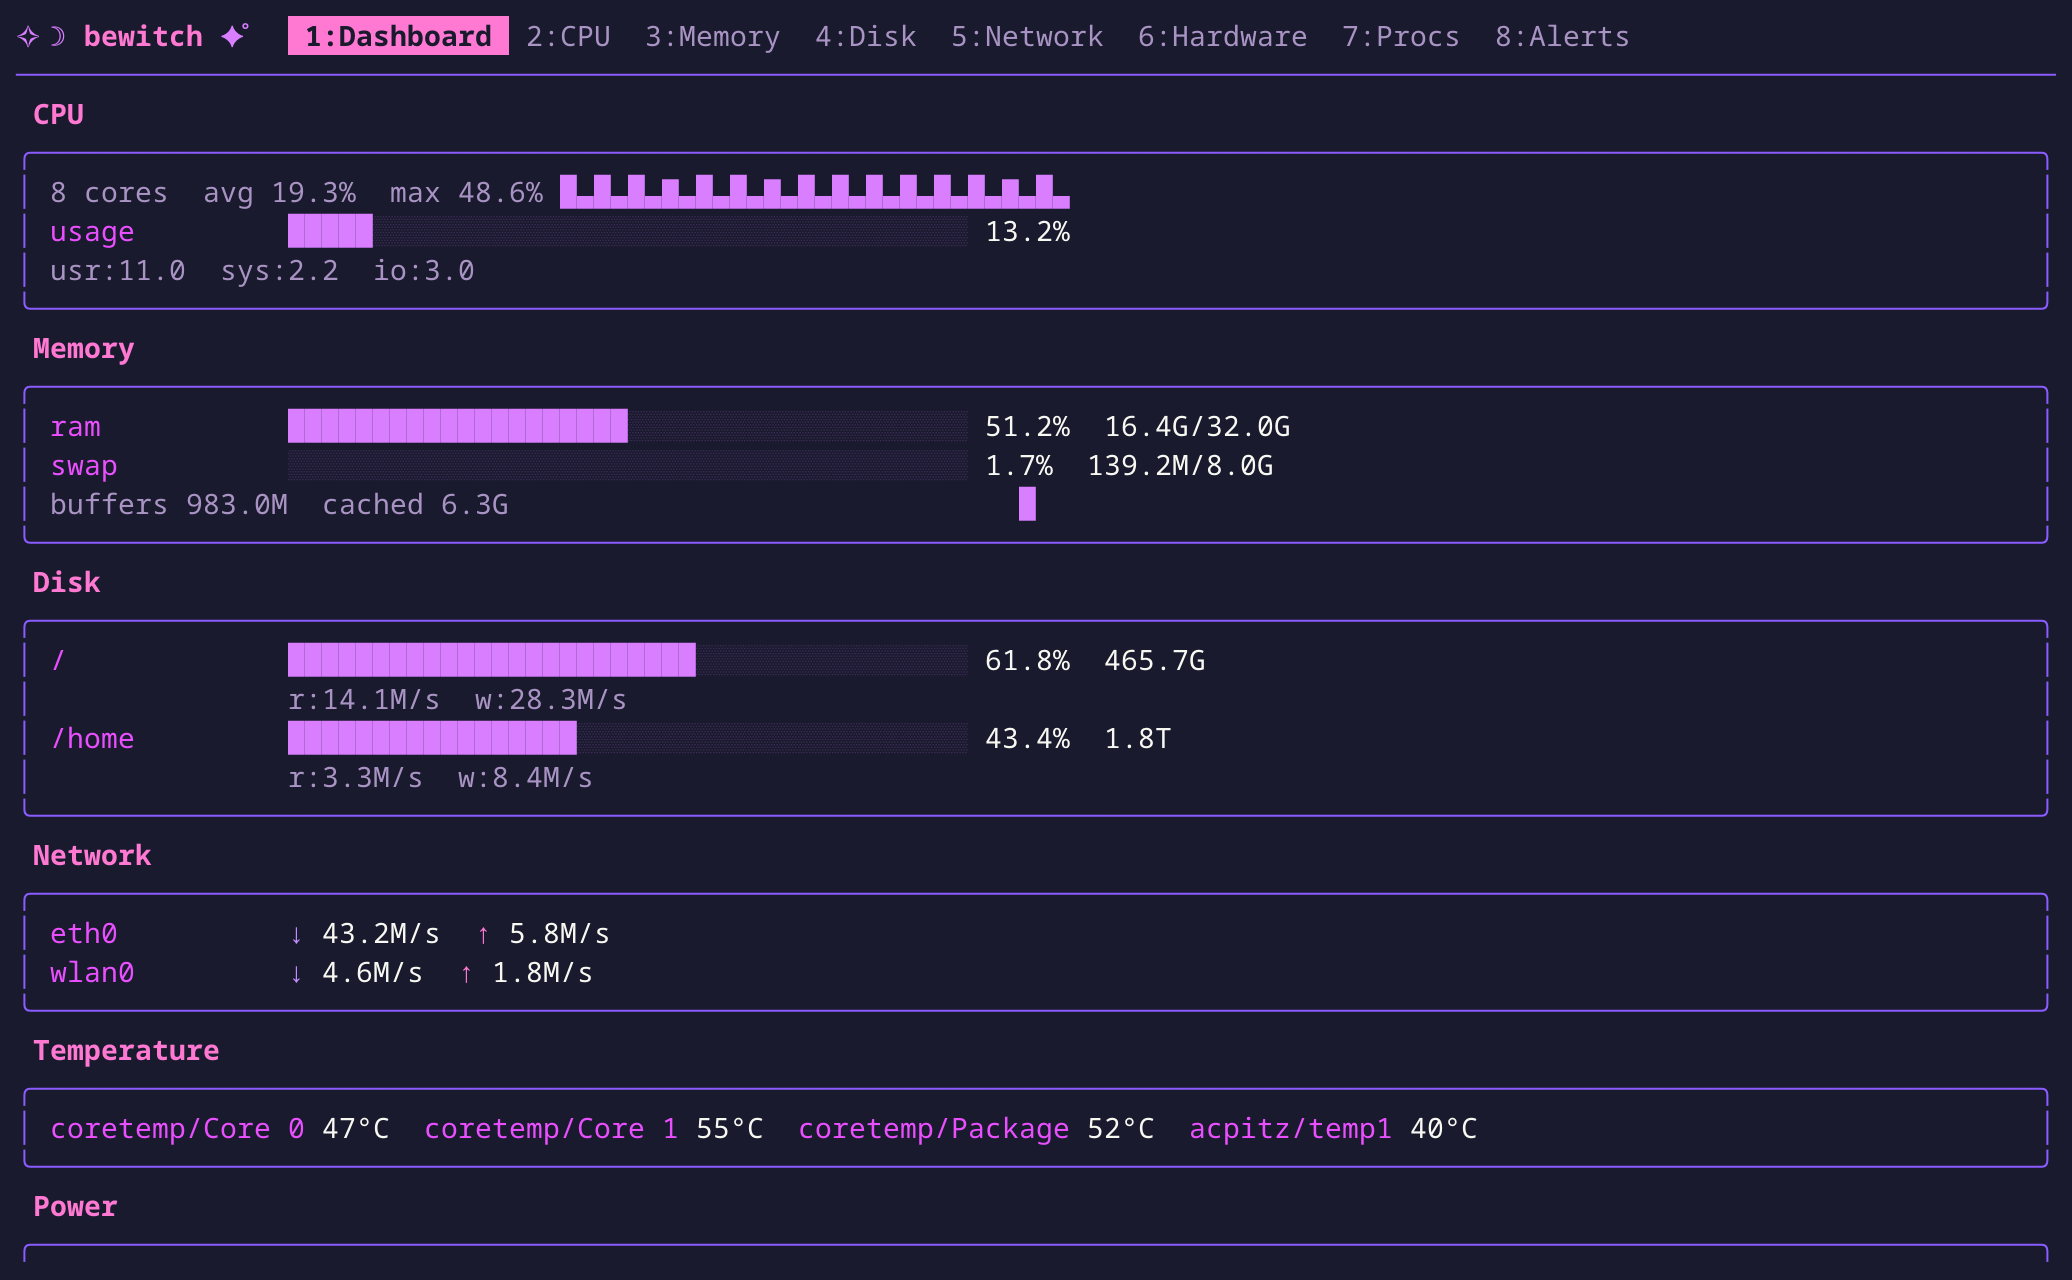
A charming system monitor.
The basement rack. The Pi behind the TV. That one VPS you keep meaning to cancel. bewitch keeps an eye on them so you don't have to remember to.
A daemon collects the metrics and a TUI makes them legible — live dashboards, historical braille charts, SMART and hardware health, alerts, and a SQL REPL over your own data. It comes in one colour: hot pink.
$ curl -sSL https://bewitch.dev/install.sh | sh
Most monitoring is built for fleets — clusters, dashboards-as-a-service, a control plane bigger than the thing it's watching. You have three machines and a hunch that one of them is dying.
bewitch fills that gap. Two small binaries: a daemon that quietly reads /proc and /sys into a local DuckDB file, and a TUI that makes the numbers legible. No cloud account, no agents to herd, no monthly bill. It runs lean enough to leave on a 1GB host and forget about — which is the point.
It will not scale to a thousand nodes. It was never trying to. It's for the handful of machines you actually care about.
Per-core and aggregate usage, live and as history you can scroll back through — deltas computed for you.
Used, available, and free at a glance, plus ECC error counts — because silent bit-flips on a long-running box are exactly the thing you won't notice in time.
Space, I/O rates, and SMART health read per physical device — NVMe and SATA — so a failing drive isn't a surprise.
Per-interface RX and TX charted over time, with a keystroke to flip between bits and bytes — for when something's hammering the uplink and you'd like to know who.
Temperature sensors, Intel and NVIDIA GPUs, RAPL power draw, and ECC — every reading the board will report, in one place.
Every process is visible; the busy ones get the full detail, and a glob pattern pins the handful you actually care about — sortable, searchable, no scrolling roulette.
Threshold, predictive, and variance rules, stored in the database and edited in the TUI — delivered by email or any shell command you can write.
Other monitors show you now. bewitch keeps the history — and lets you query it in SQL.
Everything bewitch collects lands in DuckDB, and bewitch repl is a real console over your own history — tab completion, multi-line queries, dot-commands, and export to CSV, Parquet, or JSON. Ask it whatever you like.
Route a firing alert to email (SMTP or the local mail command) or hand it to a shell command with the details in environment variables. Want it in Slack, on your phone, or as a blinking light on a shelf? Write four lines of config and it's done.
Turn on the TCP listener and it speaks TLS by default with a self-signed cert. First connection shows you the fingerprint and asks once; after that it's pinned in known_hosts. Add a bearer token if you want one. No CA, no cert renewal calendar.
Install it
Open the TUI